Configure a more complex application
In the previous section of the tutorial, we added an application and deployed it. However, the installation process was extremely simple and required very minimal configuration.
In practice, adding a Django application will generally require more complex configuration.
We'll explore this by adding Django Debug Toolbar to the application.
Add django-debug-toolbar to requirements.in
The Django Debug Toolbar installation notes suggest to install it using pip install django-debug-toolbar. The latest stable version at the time of writing is 2.2, so add:
django-debug-toolbar==2.2
to requirements.in.
As before, run docker compose build web to rebuild the application with the new
requirement.
Configure settings.py
Django Debug Toolbar requires various settings to be configured.
Configure INSTALLED_APPS
Debug Toolbar requires django.contrib.staticfiles and debug_toolbar to
be present in INSTALLED_APPS. Is django.contrib.staticfiles already there? There's an easy way to check: run
docker compose run web python manage.py diffsettings
The Django diffsettings management command shows the differences between your settings
and Django's defaults. In this case it should reassure us that django.contrib.staticfiles is already there as it's
included in Divio Django applications by default, so we just need to add debug_toolbar to INSTALLED_APPS:
INSTALLED_APPS.extend([
    'debug_toolbar',
])
Configure middleware settings
The installation documents note that we must set up the middleware, and that it should come as soon
as possible in the list "after any other middleware that encodes the response's content, such as GZipMiddleware."
A suitable place would be right after django.middleware.gzip.GZipMiddleware, and we can use a little Python list
manipulation to insert it there. In addition, it makes sense only to activate the Debug Toolbar middleware when we're running with Django's Debug mode, and we'll check for this (with if DEBUG:):
if DEBUG:

    MIDDLEWARE.insert(
        MIDDLEWARE.index("django.middleware.gzip.GZipMiddleware") + 1,
        "debug_toolbar.middleware.DebugToolbarMiddleware"
        )
This will find the GZipMiddleware in the list, and insert the DebugToolbarMiddleware immediately after it.
Triggering the toolbar
The toolbar should only be triggered if certain conditions are met. By default, it's only if DEBUG = True and the
server IP address is listed in INTERNAL_IPS.
With Docker, we don't have a way to know what internal IP address an application will have, so we can't rely on that.
However, relying on DEBUG will be enough, so we define a function that will serve as a SHOW_TOOLBAR_CALLBACK
callback to replace the default.
At the end of the settings.py file, add:
def show_toolbar(request):
    return DEBUG

DEBUG_TOOLBAR_CONFIG = {"SHOW_TOOLBAR_CALLBACK": show_toolbar}
Configure urls.py
We need to include the debug_toolbar.urls in the application's URL configuration. Our approach here is similar: we
only want it active in DEBUG mode, so add this to the end of your application's urls.py:
from django.conf import settings

if settings.DEBUG:

    from django.urls import include, path
    import debug_toolbar
    urlpatterns = [
        path('__debug__/', include(debug_toolbar.urls)),
    ] + urlpatterns
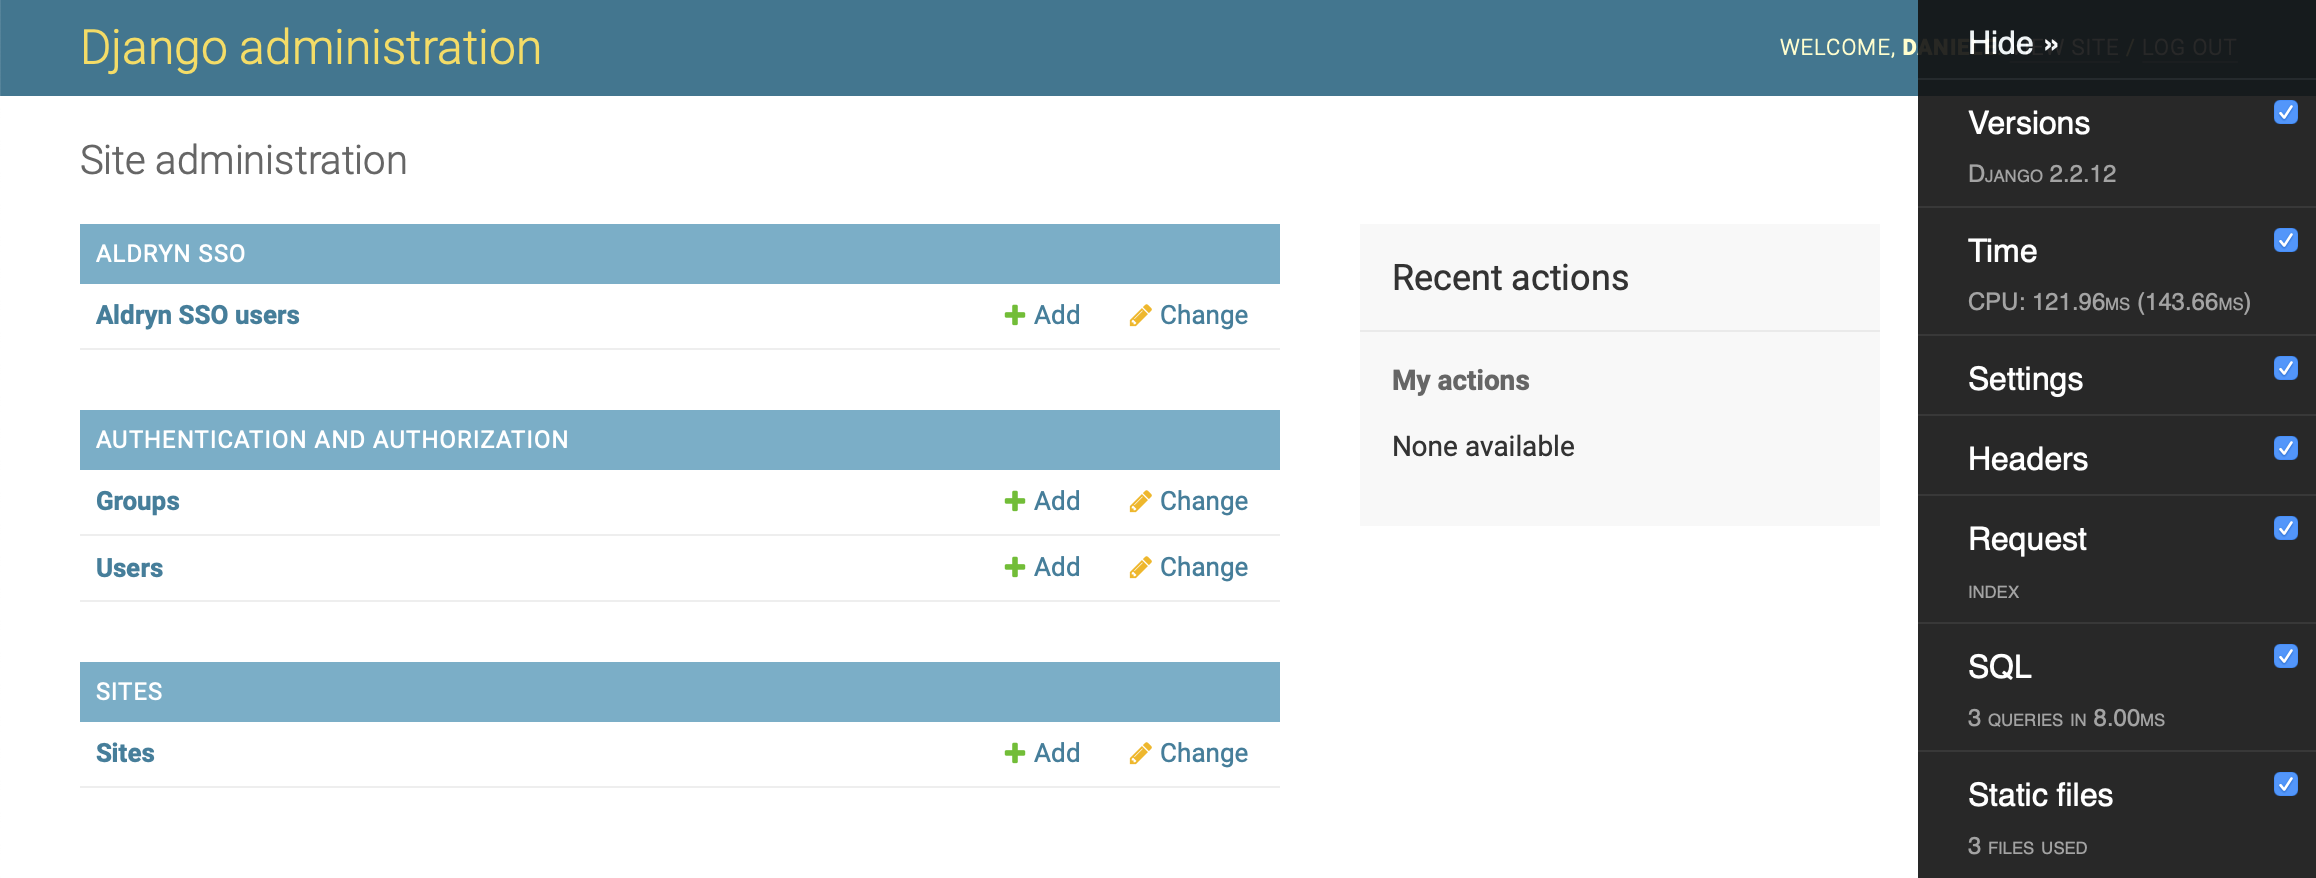
See the results
And that's it (Debug Toolbar has no database tables, so you don't need to run migrations).
Visit the admin to see the Debug Toolbar in action.
Where to go next?
This completes the basic cycle of application creation, development and deployment; you should now be familiar with the fundamental concepts and tools involved.
Other sections of the documentation expand upon them. The how-to guides in particular cover many common operations. And if there's something you're looking for but can't find, please contact Divio support.