Metrics (Beta)
The Metrics view is currently provided as a Beta feature.

Real-time metrics provide you with an insight into the behaviour and performance of your applications.
Metrics are shown for each environment of your application.
For the Live environment only, more than one container instance may be serving the application. In this case the metrics represent the total memory and CPU consumption across all the instances. In normal operation, each instance will experience roughly equal resource consumption. However it is possible that processes running in one container can consume excessive resources in that instance alone. In such a cases, although the overall consumption may appear to be within limits, the affected container can cause errors in the running application.
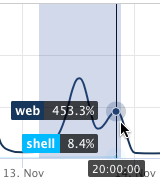
You can select the period of the charts, and also zoom in for more detail by dragging over a particular section.
Memory usage
Figures for RAM represent the total usage across the instances in each environment. RAM and the number of instances (deployed Docker containers running in parallel) are determined by the application's subscription.
An application with 2 instances of 2GB each has a total of 4GB RAM allocated to it. A bar in the memory usage chart that reaches 1.8GB for such an application would typically indicate that each instance is using around 900MB.
Above 2GB per instance the application would have exceeded its RAM allocation. However, we include very generous head-room of 100% and operate soft limits, so that an application can exceed these limits for short periods without running into problems.
When an individual instance reaches 200% of its nominal RAM allocation, errors will occur.
It is normal for memory consumption to increase slowly over time after a deployment, as Unix-based systems will use available memory for maximum benefit. However, steadily climbing figures that do not plateau can also be a sign of a memory leak.
CPU usage
Figures for CPU reflect the total number of instances available to the environment. With 2 instances, 200% will be available overall.
As CPU usage for an instance approaches 100% there will be a small performance loss; after that, there will be a dramatic decline in performance, and issues such as dropped connections and requests that don't get answered because there are not enough resources available to answer them.